Validation options
Quick navigation
Rotamer evaluation
C-beta deviations
Cis-peptide evaluation
CaBLAM backbone evaluation
Universal validations
Clashes and clashscore
Overview
Clash analysis is one of the signature validations offered by MolProbity. "Clashes" are steric overlaps of 0.4Å or greater between non-bonded atoms. Such interactions carry a severe energy penalty and should be avoided.Chart report
Most clashes are colored outlier pink.
Severe clashes are steric overlaps >0.9Å. These clashes are colored bright red.
Kinemage report
In the multicrit kinemage, clashes are displayed as hot pink spikes between atoms.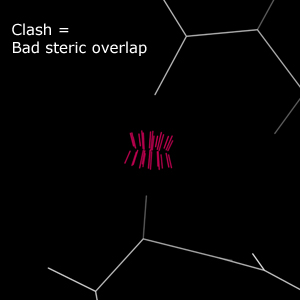
Usage notes
Clash analysis is one of our most sensitive methods for identifying problems in structures and should always be used. However, in difficult structures, it may be necessary to overlook the mild clashes and focus on more severe overlaps. In high-resolution structures, mild clashes should be attended to with the same care as their more severe kin.Further Information
Word, J. M., Lovell, S. C., LaBean, T. H., Taylor, H. C., Zalis, M. E., Presley, B. K., Richardson, J. S. & Richardson, D. C. (1999). Visualizing and quantifying molecular goodness-of-fit: small-probe contact dots with explicit hydrogen atoms. Journal of molecular biology, 285(4), 1711-1733. doi:10.1006/jmbi.1998.2400Chen, V. B., Arendall, W. B., Headd, J. J., Keedy, D. A., Immormino, R. M., Kapral, G. J., Murray, L. W., Richardson, J. S., & Richardson, D. C. (2009). MolProbity: all-atom structure validation for macromolecular crystallography. Acta Crystallographica Section D: Biological Crystallography, 66(1), 12-21. doi: 10.1107/S0907444909042073
Hydrogen bonds
Overview
Hydrogen bonds are close contacts between polar atoms and hydrogen atoms. These contacts are energetically favorable and play an important role in stabilizing macromolecular structures. Hydrogen bonds are expected in protein secondary structure, between RNA bases, and elsewhere.Chart report
Hydrogen bonding is not currently reported in the multicrit chart.Kinemage report
In the multicrit kinemage, hydrogen bonds are represented as "pillows" of greentint dots between the bonding atoms. These dots fall on the surfaces of the bonding atoms' van der Waals spheres. A larger overlap indicates a stronger bond and is represented by a larger "pillow".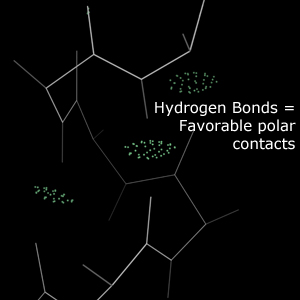
Usage notes
Regular hydrogen bonding patterns define protein secondary structure and RNA base pairing. Weak or missing bonds in these positions may indicate modeling errors.Further Information
Word, J. M., Lovell, S. C., LaBean, T. H., Taylor, H. C., Zalis, M. E., Presley, B. K., Richardson, J. S. & Richardson, D. C. (1999). Visualizing and quantifying molecular goodness-of-fit: small-probe contact dots with explicit hydrogen atoms. Journal of molecular biology, 285(4), 1711-1733. doi:10.1006/jmbi.1998.2400van der Waals contacts
Overview
van der Waals contacts are close contacts between non-bonding atoms. Contacts between hydrophobic surfaces, especially in the interior of a structure, are generally favorable.Chart report
van der Waals contacts are not currently reported in the multicrit chart.Kinemage report
In the multicrit kinemage, van der Waals contacts are represented by dots between atoms in a variety of colors. Cool-colored dots (blues and greens) indicate favorable packing between atoms. Warm-color dots (yellow, orange, and red) indicate small steric overlaps that do not rise to the level of Clashes.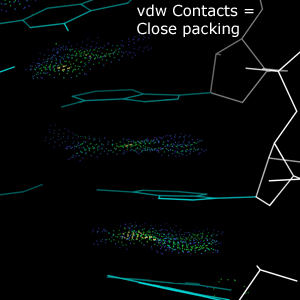
Usage notes
Sparse van der Waals contacts may be indicative of underpacking in a model.For very large structures, the proliferation of vdw contact dots may slow down kinemage navigation. van der Waals contacts are therefore automatically turned off for large structures, but may be turned on if desired.
Further Information
Word, J. M., Lovell, S. C., LaBean, T. H., Taylor, H. C., Zalis, M. E., Presley, B. K., Richardson, J. S. & Richardson, D. C. (1999). Visualizing and quantifying molecular goodness-of-fit: small-probe contact dots with explicit hydrogen atoms. Journal of molecular biology, 285(4), 1711-1733. doi:10.1006/jmbi.1998.2400Deis, L. N., Verma, V., Videau, L. L., Prisant, M. G., Moriarty, N. W., Headd, J. J., Chen, V. B., Adams, P. D., Snoeyink, J., Richardson, J. S., & Richard, D. C. (2013). Phenix/MolProbity hydrogen parameter update. Computational Crystallography Newsletter, 4, 8-10. PDF Link
Geometry evaluation
Overview
Geometry evaluation checks covalent bond lengths and covalent bond angles against the bond geometry expectations established by Engh and Huber for protein structures. For RNA structures, bond lengths and bond angles depend on the pucker of the ribose sugar, and are checked against the pucker-specific values implemented in PHENIX. Bond lengths and bond angles that differ from the expected values by more than 4σ are considered outliers.Chart report
In the multicrit chart, the worst geometry outlier for each residue is reported. Most outliers (4σ to 10σ) are colored outlier pink. Particularly severe outliers (those that deviate from the expected value by 10σ or more) are colored birght red.Kinemage report
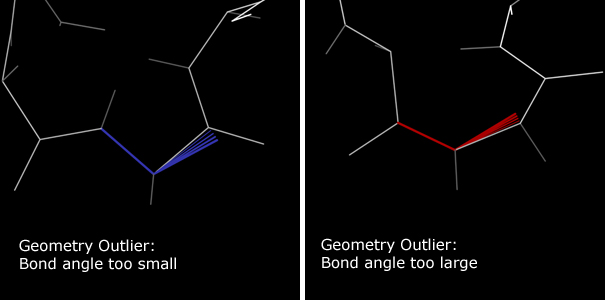
Bond length deviations are marked in the multicrit kinemage with colored springs along the deviant bonds.Extended red springs indicate covalent bonds that are too long.
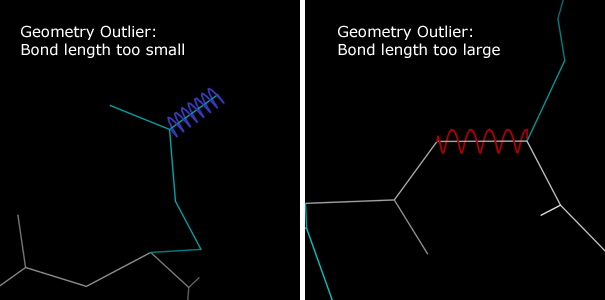
Bond angle deviations are marked with colored fans along the deviant angle.
Narrowing red fans indicate bond angles that are too wide.
Usage notes
Bond geometry validation is always recommended. The expected values for bond geometry are well-established, and deviations from these expectations are generally serious.Warning: Bond geometry in ligands may be identified as outliers without cause. There is a great variety of possible ligands, and the expected bond geometries of all these possibilities are not as well defined as the geometries of protein and RNA.
Further Information
Engh, R. A., & Huber, R. (1991). Accurate bond and angle parameters for X-ray protein structure refinement. Acta Crystallographica Section A: Foundations of Crystallography, 47(4), 392-400. doi: 10.1107/S0108767391001071Engh, R. A., & Huber, R. (2001). Structure quality and target parameters. In International Tables for Crystallography Volume F: Crystallography of biological macromolecules (pp. 382-392). Springer Netherlands. doi: 10.1107/97809553602060000695
Protein Validations
Ramachandran evaluation
Overview
Ramachandran validation is a long-standing evaluation of protein backbone conformation that uses the φ and ψ backbone dihedrals. Ramachandran analysis assigns residues to one of three categories: Favored, Allowed, and Outlier.Chart report
Allowed residues are colored in light pink. About 2% of residues are expected to fall within the Allowed region, so these residues are not necessarily wrong, but bear inspection.
Kinemage report
In the multicrit kinemage, only Outlier residues are reported for Ramachandran analysis. These residues are marked with a green line that follows the Cα trace in the vicinity of the outlier residue.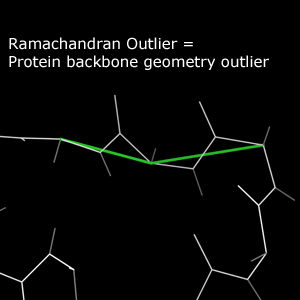
Usage notes
Ramachandran validation is broadly applicable. However, in structures with large modeling errors or many contiguous modeling errors, Ramachcandran analysis can become overwhelmed. In such cases, consider CaBLAM validation for an analysis better suited to difficult models.Further Information
Ramachandran, G.N.; Ramakrishnan, C.; Sasisekharan, V. (1963). Stereochemistry of polypeptide chain configurations. Journal of Molecular Biology 7: 95-99. doi: 10.1016/S0022-2836(63)80023-6Lovell, S. C., Davis, I. W., Arendall, W. B., de Bakker, P. I., Word, J. M., Prisant, M. G., Richardson, J. S., & Richardson, D. C. (2003). Structure validation by Cα geometry: φ, ψ and Cβ deviation. Proteins: Structure, Function, and Bioinformatics, 50(3), 437-450. doi:10.1002/prot.10286
Rotamer evaluation
Overview
Protein sidechain geometry generally exhibits discrete conformations. These discrete conformations are called "rotamers". Sidechains that do not fall within the bounds of a rotamer definition are considered outliers. Similar to Ramachandran analysis, rotamer analysis assignes sidechains to one of three categories: Favored, Allowed, and Outlier.Chart report
Allowed sidechains are colored in light pink. About 2% of sidechains are expected to fall within the Allowed region, so these residues are not necessarily wrong, but bear inspection.
Kinemage report
In the multicrit kinemage, only Outlier sidechains are reported for rotamer analysis. Outlier sidechains are traced in gold.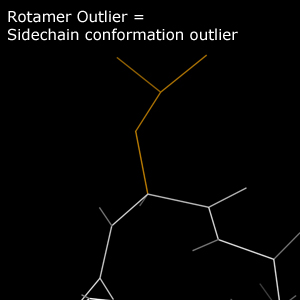
Usage notes
Assignment of specific rotamers is more important in packed regions of a protein than on the unconstrained surface. That said, the lack of packing constraint on the surface does not justify modeling of unrealistic rotamers.In low-resolution structures, it may be necessary to focus on mainchain validations before trying to resolve sidechain packing.
Further Information
Lovell, S. C., Word, J. M., Richardson, J. S., & Richardson, D. C. (2000). The penultimate rotamer library. Proteins: Structure, Function, and Bioinformatics, 40(3), 389-408. doi: 10.1002/1097-0134(20000815)40:3<389::AID-PROT50>3.0.CO;2-2Richardson, J. S. & Headd, J. J. (2012). Fitting tip: Rotamer correction, with backrubs. Computational Crystallography Newsletter, 3, 29-30. PDF link
Cbeta deviations
Overview
The Cβ deviation is an assessment of protein backbone geometry. The ideal position of a residue's Cβ atom is calculated from the geometry of that residue's main atoms. Sufficient deviation from the ideal position indicates a geometry error.Chart report
Residues with particularly severe deviations of 0.7Å or more are colored bright red.
Kinemage report
In the multicrit kinemage, Cβ deviations appear as purple spheres. Each sphere is drawn with its center at the ideal Cβ position and its edge tangent to the modeled Cβ position. As a result, the radius of the sphere is equal to the deviation, and the size of the sphere visually encodes the severity of the deviation.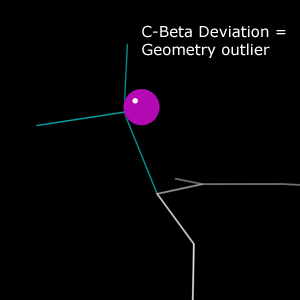
Usage notes
Cβ deviations are a backbone geometry validation, so like general bond geometry validation, it is always recommended.Further Information
Lovell, S. C., Davis, I. W., Arendall, W. B., de Bakker, P. I., Word, J. M., Prisant, M. G., Richardson, J. S., & Richardson, D. C. (2003). Structure validation by Cα geometry: φ, ψ and Cβ deviation. Proteins: Structure, Function, and Bioinformatics, 50(3), 437-450. doi:10.1002/prot.10286Cis-peptide evaluation
Overview
The peptide bond that joins adjacent amino acids has partial double bond character. As a result this bond assumes either a planar trans or a planar cis conformation. Trans is the default conformation. The cis conformation is most common preceding proline, and roughly 5% of PRO residues assume a cis conformation. Only about 0.05% of non-proline residues assume a cis conformation. This validation identifies cis-peptides and reports whether the cis-peptide content of a structure exceeds the above statistical expectations.An additional validation category identifies residues with peptide bond dihedrals far (>30°) from the expected planar trans or planar cis conformations. These residues are identified as having Twisted peptides.
Chart report
In the multicrit chart, non-proline cis-peptides and all twisted peptides are identified as probable outliers. Non-proline cis-peptides do occur, but require strong support from the data, like other unusual conformations. Cis-prolines are identified for user convenience, but are not marked as probable outliers due to their higher expected occurence.Kinemage report
In the multicrit kinemage, cis-peptides are marked with a sea green shape that fills the space between the mainchain trace and the Cα trace at the cis-peptide location. Twisted peptides are marked with a similar shape in lime green. The angle between this shape's component triangles serves as a visual indicator of the severity of the twist.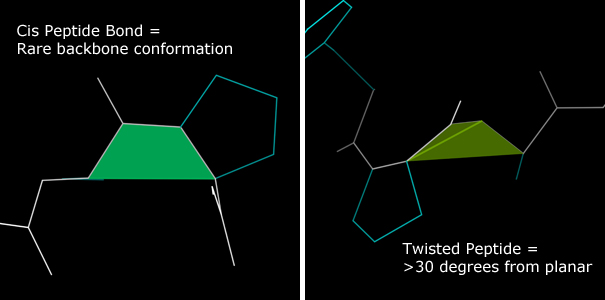
Usage notes
Cis-peptide validation is always relevant, but is especially important in low-resolution structures and in structures with regions of uncertainty. Some methods can introduce extraneous cis-peptides in regions of ambiguous electron density.Further Information
Williams, C. J. & Richardson, J. S. (2015). Avoiding excess cis peptides at low resolution or high B. Computational Crystallography Newsletter, 6, 2-6. PDF linkCaBLAM backbone evaluation
Overview
CaBLAM is a method for validating the quality of protein backbone, especially of secondary structure elements in structures at resolutions 2.5Å and lower. CaBLAM uses the relative orientations of adjacent carbonyl oxygens to identify errors in peptide plane orientation - errors common in low-resolution structures. CaBLAM uses Cα geometry - relatively reliable at low resolution - to identify secondary structure elements hidden by those errors.Chart report
CaBLAM Outlier indicates a Cα geometry/peptide plane orientation combination falling in the bottom 1% of observed protein behaviors. These errors are roughly analogous to Ramachandran Outliers in severity.
CaBLAM Disfavored indicates a Cα geometry/peptide plane orientation combination falling the bottom 5% of observed protein behaviors. Residues marked this way may have valid conformations, especially in loop regions. However, especially in low-resolution structures, residues marked as CaBLAM Disfavored should be treated with more suspicion than the otherwise analogous Ramachandran Allowed residues.
Kinemage report
In the multicrit kinemage, CA Geometry Outliers are identified with red bars over the associated Cα virtual angle. CaBLAM Outliers and CaBLAM Disfavoreds are marked with bars that trace the carbonyl oxygen dihedral often indicative of modeling errors. CaBLAM Outliers use pink, and CaBLAM Disfavoreds use purple.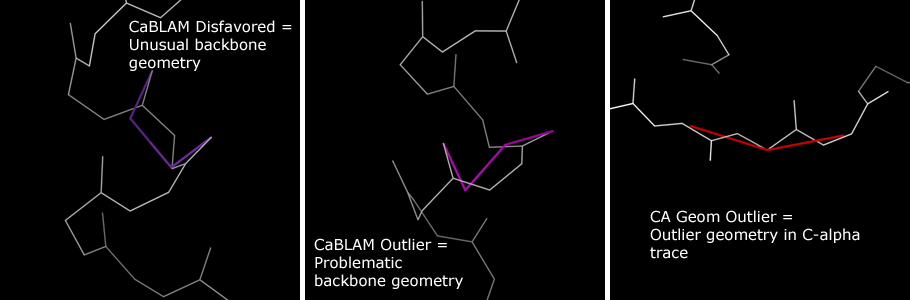
Usage notes
CaBLAM is designed to provide validation for structures in the 2.5Å-4.0Å resolution range. Within this range, CaBLAM's validation may be more helpful for correcting a structure than Ramachandran analysis. At higher resolutions, the errors CaBLAM assesses become less common. CaBLAM provides strong validation of secondary structure elements, but is prone to generating apparent false positives in loop regions. Remember: Up to 5% of the residues in a structure are expected to be CaBLAM Disfavored!Further Information
Williams, C. J., Hintze, B. J., Richardson, D. C. & Richardson, J. S. (2013). CaBLAM: Identification and scoring of disguised secondary structure at low resolution. Computational Crystallography Newsletter, 4, 33-35. PDF linkRNA Validations
RNA sugar pucker analysis
Overview
The ribose sugar in RNA residues adopts one of the two main pucker conformations: C3'-endo pucker and C2'-endo pucker. The δ backbone dihedral angle (C5'-C4'-C3'-O3') encodes the sugar pucker, with the mean value of δ angle being 84° for C3'-endo, and 145° for C2'-endo pucker. The perpendicular distance from the 3' phosphorus atom to the extended line the glycosidic bond vector, called the Pperp distance, is visually and empirically corelated with the sugar pucker, with Pperp distance ≥ 2.9Å for C3'-endo and < 2.9Å for C2'-endo pucker. This validation identifies RNA residues that have incorrectly modeled sugar puckers, by cross-checking the Pperp distance and the δ angle value.Chart report
In the multicrit chart, two kinds of sugar pucker outliers are reported and colored in outlier pink.ε outlier: where the ε backbone angle lies outside the allowed range of 155° - 310°. ε angle outliers are also found to indicate misfit sugar pucker.
Kinemage report
In the multicrit kinemage, sugar pucker outliers are identified by a magenta cross pointing along the glycosidic bond vector. The magenta cross is connected to the 3' phosphorus atom, and the corresponding distance is the Pperp distance. The color of the cross is purple if the residue is an outlier only in ε.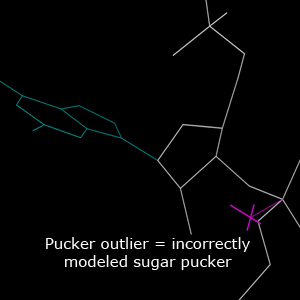
Usage notes
Our RNA sugar pucker validation is a very robust method for detecting pucker outliers and should always be used. This is especially useful for low resolution structures where the electron density alone is not sufficient to determine the sugar pucker. Very rarely, there may be cases of RNA resiudes adopting a different sugar pucker other than C3'-endo or C2'-endo, especially in active sites. However, such cases should only be trusted if there is strong supporting evidence.Further Information
Jain, S., Kapral, G. J., Richardson, D. C. & Richardson, J. S. (2014) Getting the Pucker Right in RNA Structures. Computational Crystallography Newsletter, 5:4-7. PDF linkJain, S., Richardson, D. C. & Richardson J. S. (2015) Computational Methods for RNA Structure Validation and Improvement. Methods in Enzymology doi:10.1016/bs.mie.2015.01.007
RNA backbone conformations
Overview
RNA backbone is known to be rotameric. The RNA Ontology Consortium has identified 54 all-angle conformers that the RNA backbone is most likely to adopt. These conformers are defined for the sugar-to-sugar unit for the RNA backbone, called a "suite". Each backbone conformer has a two character name. This validation identifies RNA suites that do not belong to any of the known backbone conformers.Chart report
In the multicrit chart, all complete RNA backbone suites are reported.Suites that do not belong to any of the known backbone conformers are reported as outliers and colored in outlier pink. In addition, if any of the backbone dihedral angles of a suite individually lie outside the allowed range of values, it is marked as triaged.
Kinemage report
Backbone conformer outliers are currently not marked in the multicrit kinemage.Usage notes
The known backbone conformers identify the most likely conformations of the RNA backbone, but they certainly do not cover all the possibilites. Outlier suites can occasionally be valid and interesting. Please do not force your structure to have no backbone conformer outliers. If a backbone conformation fits the electron density and has no other kind of outliers (steric clashes, pucker outliers, geometry outliers), then it is very likely to be valid.Further Information
Richardson, J. S., Schneider B., Murray, L. W., Kapral, G. J., Immormino, R. M. et. al. (2008) RNA Backbone: Consensus all-angle conformers and modular string nomenclature (an RNA Ontology Consortium contribution). RNA, 14(3):465-481. PDF linkMurray, L. W., Arendell, W. B., Richardson, D. C. & Richardson J. S. (2003) RNA Backbone is Rotameric. PNAS 100(24): 13904-13909. doi:10.1073/pnas.1835769100
Jain, S., Richardson, D. C. & Richardson J. S. (2015) Computational Methods for RNA Structure Validation and Improvement. Methods in Enzymology doi:10.1016/bs.mie.2015.01.007